See how Opendate can help you manage the entire event lifecycle.
Let us know who you are to unlock the demo video.
Thank you! Your submission has been received!
Oops! Something went wrong while submitting the form.
Every venue marketer starts the morning with the same question:
Is this show okay?
Answering it has always been harder than it should be. Sales numbers live in the ticketing report. Traffic lives in an analytics tool. Ad results live in Meta's dashboard. The buyer list lives somewhere else entirely. So you stitch it together, or you guess.
And when a show is soft, the most important question of all goes unanswered: is this an attention problem, where not enough people are seeing the event, or a conversion problem, where people look but don't buy?
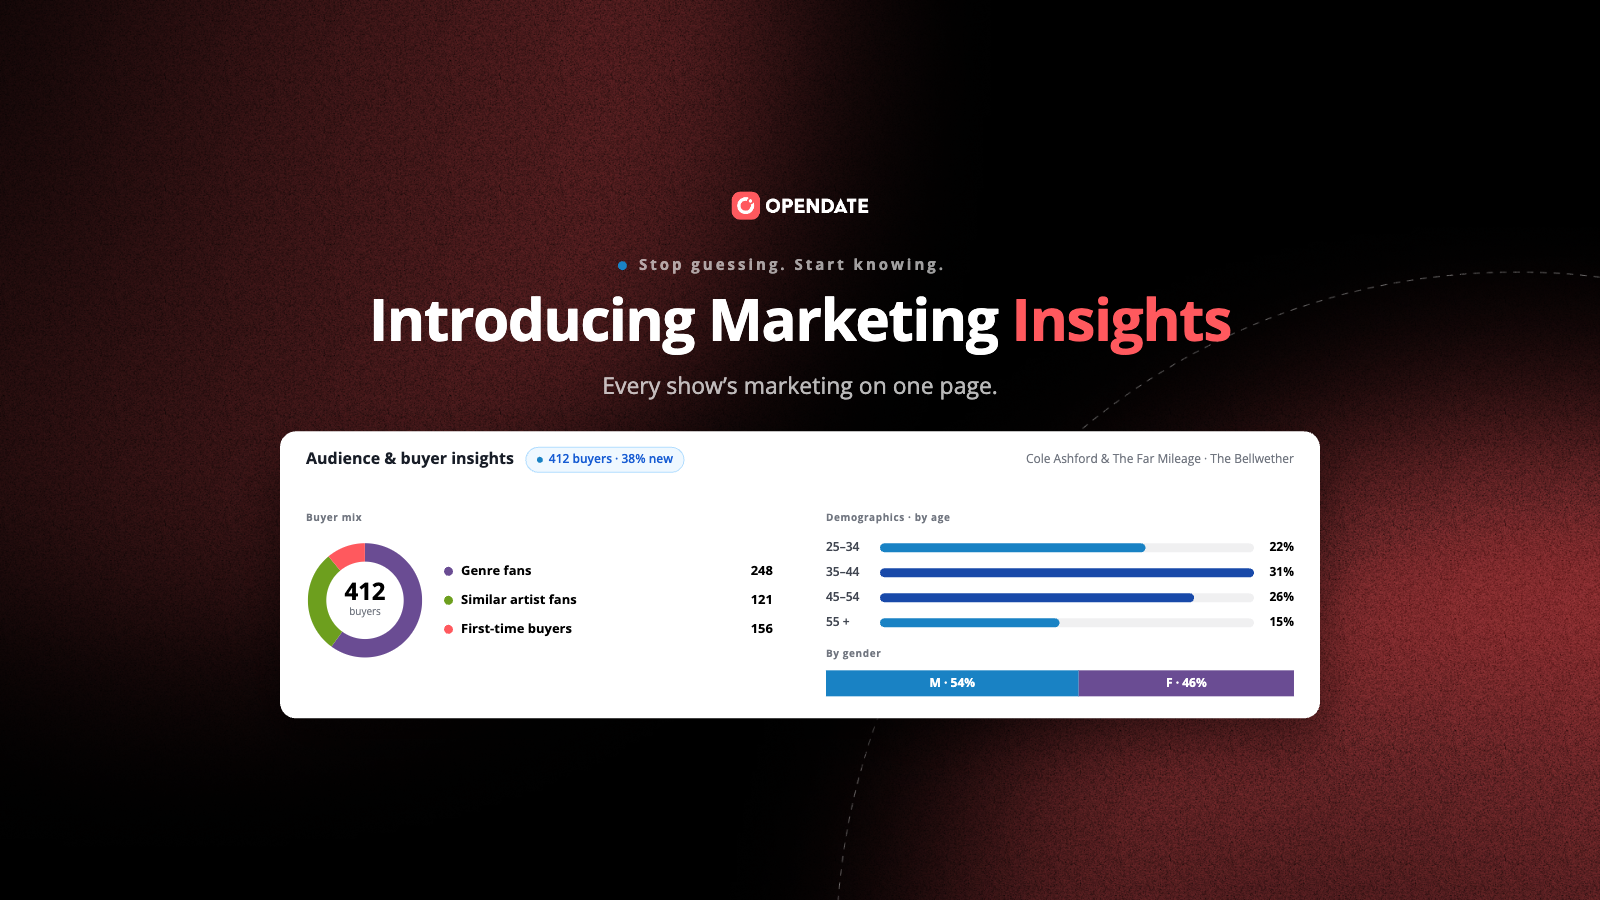
Today we're launching Marketing Insights to answer that question for every show, on one page.
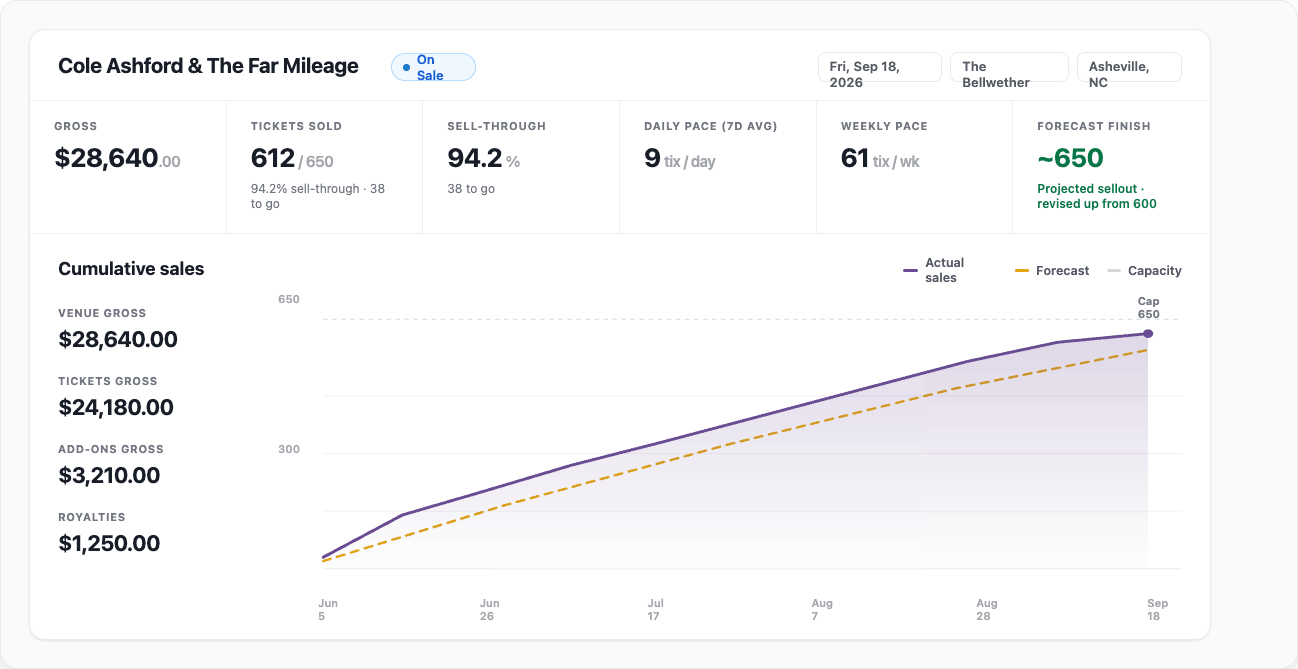
See the pace, not just the count. The cumulative sales chart shows your actuals against a forecast and an overlay of comparable shows, with daily and weekly pace and an expected finish. You'll know a show is drifting weeks before the walk-up.
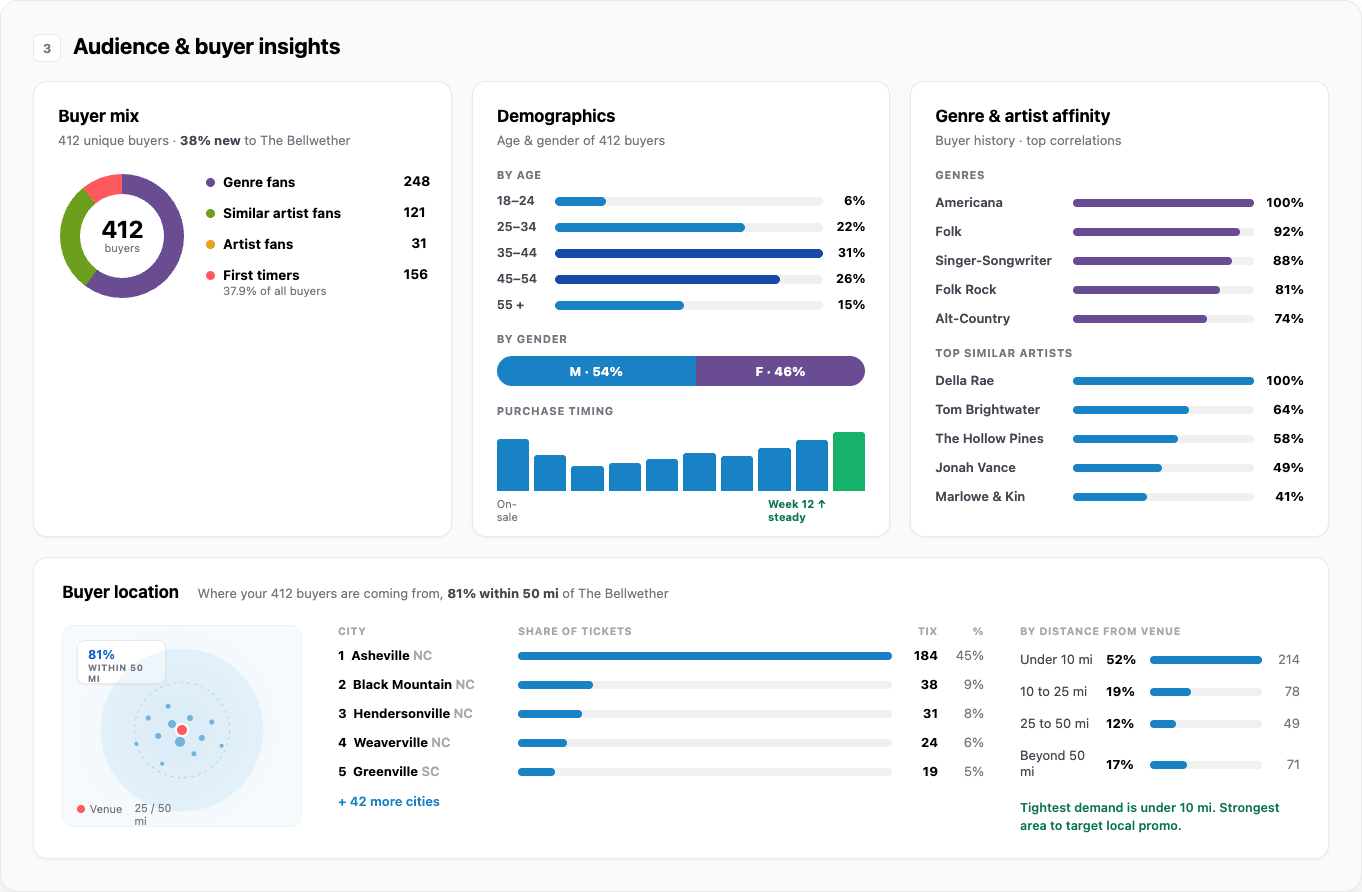
Know exactly who is buying. Age, gender, purchase timing, and genre and artist affinity, built from your real buyer data. Not who you think your audience is. Who it actually is.
Follow the funnel. Views, unique sessions, and orders in one funnel, with a sources table showing where buyers came from, down to the individual trackable link and Meta ad.
Act on what you see. Auto-built segments are ready for your next email or SMS campaign, so the diagnosis turns into action in a couple of clicks.
Venues on Opendate already attribute as much as 25% of ticket sales to marketing automations. Marketing Insights is how you see that engine working, prove it, and tune it, show by show.
Marketing Insights is live now for all Opendate customers.