See how Opendate can help you manage the entire event lifecycle.
Let us know who you are to unlock the demo video.
Thank you! Your submission has been received!
Oops! Something went wrong while submitting the form.

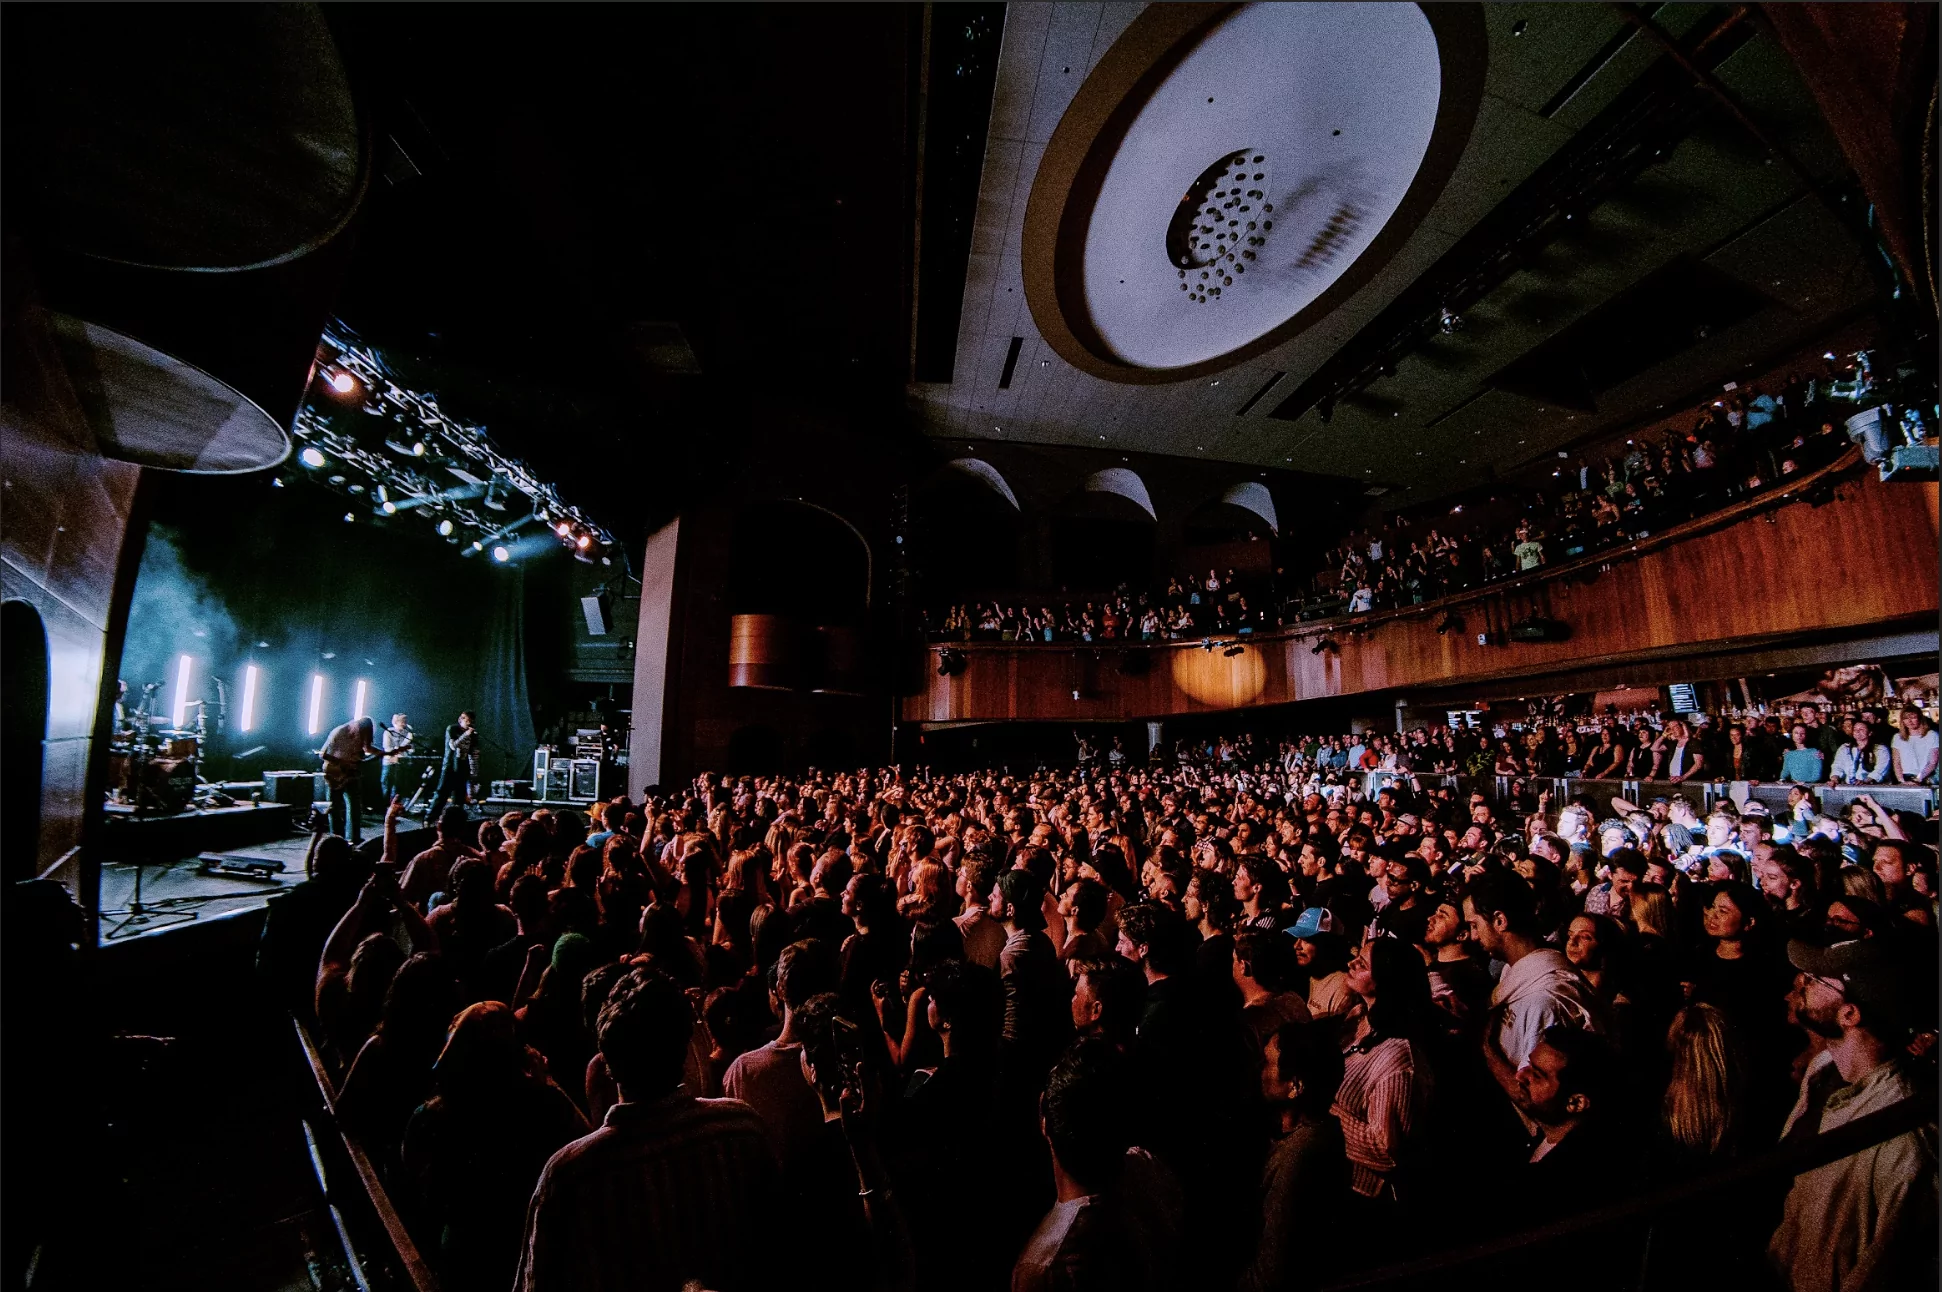
Walk into any music venue, performing arts center, or attractions operation on a Monday morning and you'll hear a familiar question:
"How are we doing?"
Answering it usually means stitching together numbers from five different places. It's a settlement doc here, a box-office report there, an embedded analytics view in one tab, a marketing dashboard in another, and someone's spreadsheet for everything else. By the time you've reconciled it all, the standup is over and you're already a step behind.
We've believed for a while that this is backwards. Reports shouldn't live in another tab. They should live in the same product where the work happens.
So we built one.
The new Reports Dashboard is the native, real-time reporting layer built directly into Opendate. It includes a high-level Dashboard for the at-a-glance health of your operation, plus six dedicated lenses for deeper dives:
Every report is filterable, exportable to CSV, and powered by the same data that runs your settlements — so the numbers reconcile by design.
The dashboard was built with one principle: it should answer the questions you ask every day, in the language you ask them in.
For talent buyers, that means contribution margin and offer-to-confirm conversion. For GMs and executive directors, that means revenue trend, F&B run rate, and event-by-event health. For ticketing directors, that means sales velocity, refunds, and ticket audits. For marketing teams, that means ad spend mapped to actual ticket revenue. For finance, that means payouts and BMI/PRO compliance.
The same dashboard, six different lenses. One source of truth.
Whether you run a 200-cap club, a 2,000-seat performing arts center, or a multi-venue attractions operation, the new Reports Dashboard puts your numbers where they belong: in the same place you already work.
No spreadsheet patchwork. No embedded views. No 20-minute reconciliation before your Monday standup.
Just real numbers, where the work happens.

.avif)